
Use the Runner
Open the Runner while writing a test or investigating a failure:
npx termwright uiThe desktop app starts the test catalogue in watch mode. Use --browser to open
the same interface in your browser, or --no-open to start the server and print
its local URL.
Run a test
Section titled “Run a test”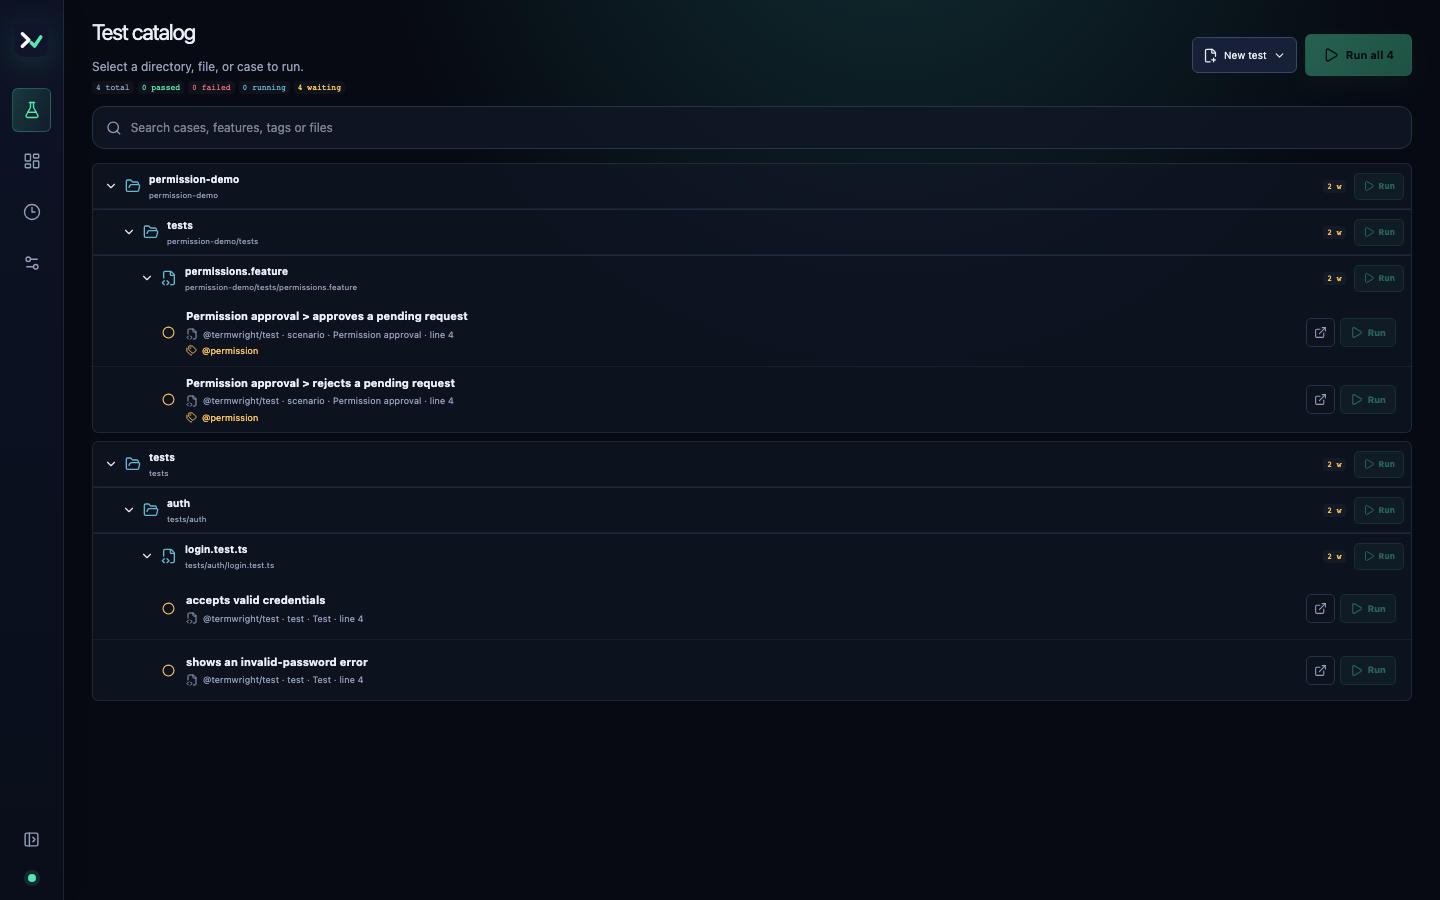
Open Specs, then run the whole project, a directory, a file, or one test. Only the selected scope appears in that run. While it is active, use Stop to cancel it.
To limit the initial catalogue from the command line:
npx termwright ui -- tests/login.test.ts -t "rejects an invalid password"Follow a live terminal
Section titled “Follow a live terminal”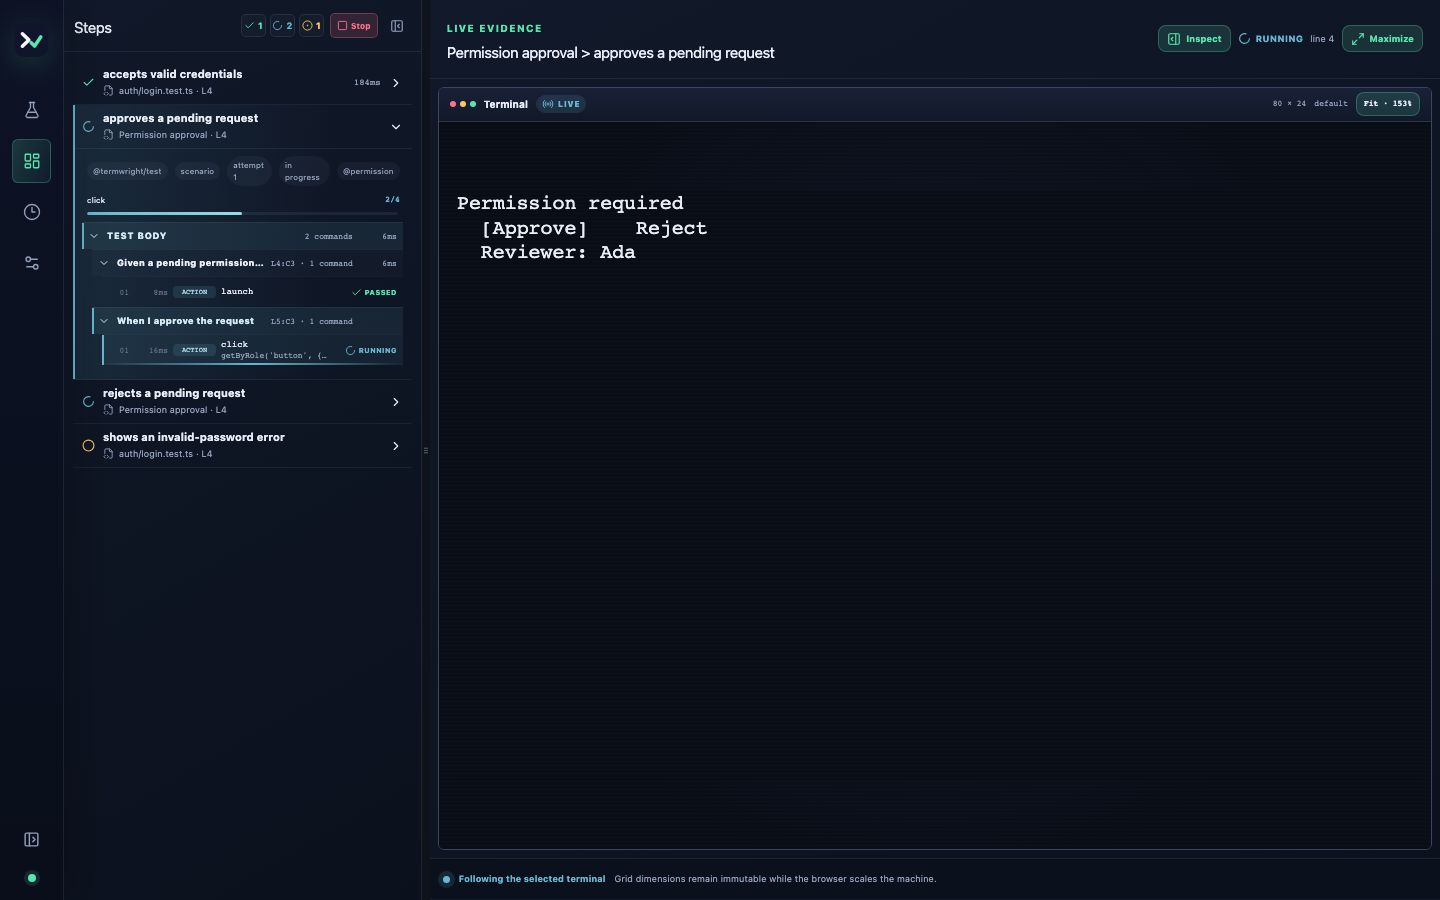
The execution list shows the active test and its current named step. Select a different running test to switch the terminal, semantic inspector, and logs. Blue means running; green is reserved for a completed pass.
Tests are grouped by source file in one scrolling list. Select a test to expand its steps directly underneath its row. Collapsed test titles use one line; long titles are available in full on hover and when expanded. Use Find a test to search names and files, or Failed to narrow the list. Selecting the current test again collapses its details while preserving the replay position.
Collapsed Gherkin steps use a single line for their name, duration, and status. Hover or focus a step for its full name, source location, and separate action and assertion counts. Expanding a step reveals its full title and commands underneath. Expand one step or choose Show commands to inspect its calls and assertions. Running and failing commands stay visible. Test details contains source, provider, tags, and attempt information.
Ordinary expect(value).toBe(...) assertions and terminal matchers appear as
assertion rows, with their outcome, both live and in retained recordings.
Negated, promise, soft, and polling assertions keep their final result; retries
inside one matcher do not create extra rows. Older recordings may omit ordinary
assertions and cannot recover them after the fact.
Hover or focus a locator assertion to preview its retained target; click to pin it. Use a locator matcher when you want to retain the connection to the element:
await expect(app.getByRole('listitem')).toHaveCount(0);await expect(app.getByRole('button', { name: 'Approve' })).toBeVisible();expect(await locator.count()).toBe(0) is also recorded, but its received value
is a number: it no longer carries the locator. Runner does not guess a selector
for it. toHaveCount(0) retains the selector and explains that no elements match;
multiple matches are also reported without choosing an arbitrary element.
Inspect a failure
Section titled “Inspect a failure”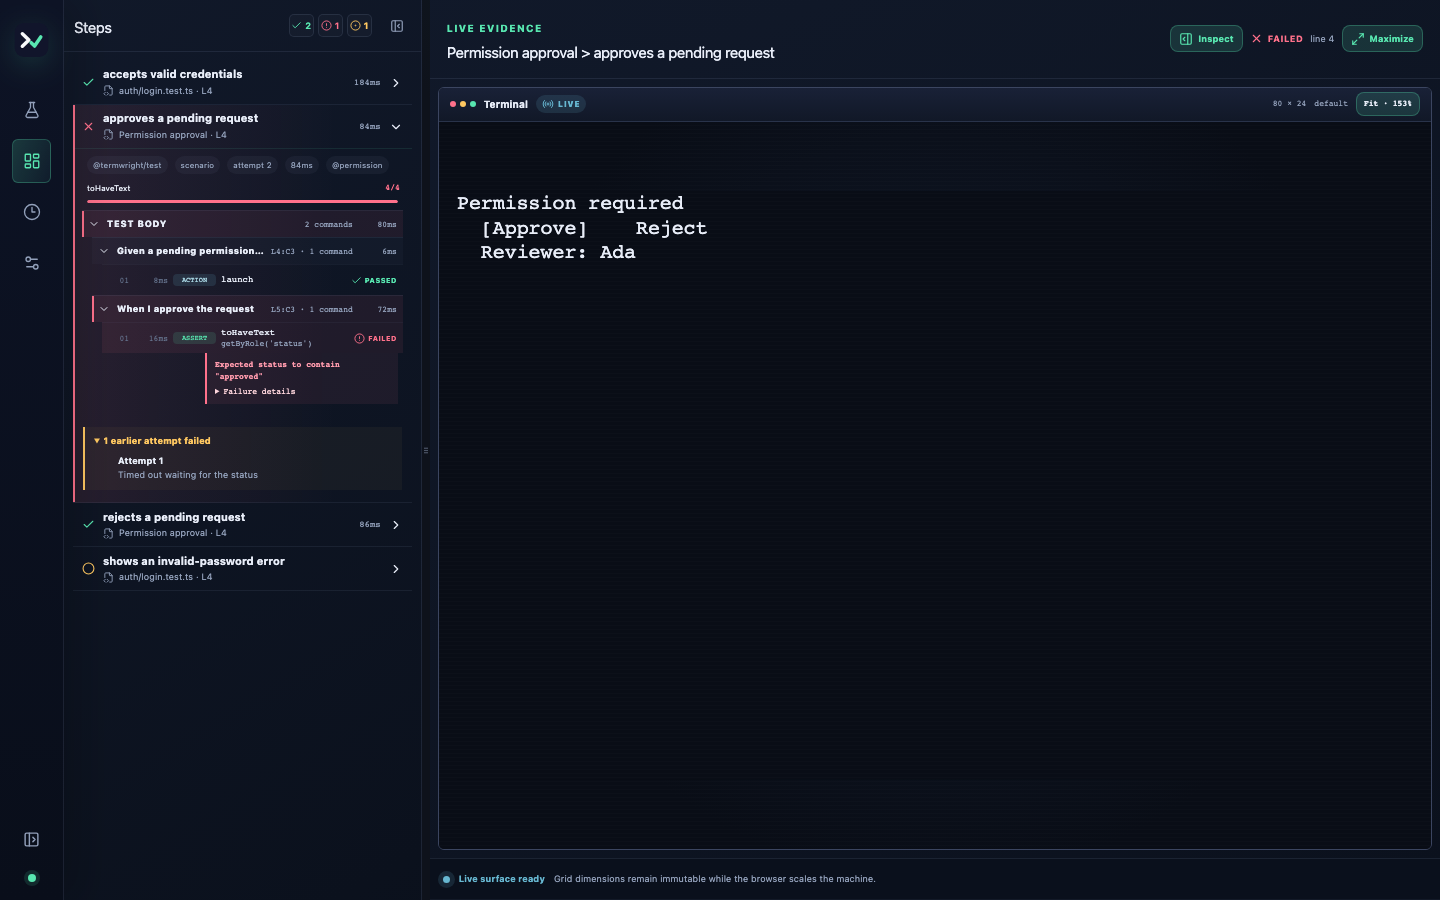
Start with the first failed row. The details show the assertion or action, source location, observed state, and any earlier retry failures. The terminal, semantics, logs, and step list stay attached to the same test attempt.
The selected test’s failure summary appears above its steps. Go to failed step opens the relevant command, scrolls it into view, and moves keyboard focus there. Expand Failure details for the complete command error and stack trace.
When a test finishes and retains a trace, its terminal switches from LIVE to replay. Use the controls under the terminal to play, change speed, seek, or jump to the previous or next step. The timeline shows event markers and time in milliseconds.
Hover over a step to preview its recorded terminal and semantic state. The Preview label distinguishes this temporary view from the selected playhead; moving the pointer away restores that position. Click a step to keep its moment selected. The terminal, inspector, and logs follow the same moment.
Inspect semantic elements
Section titled “Inspect semantic elements”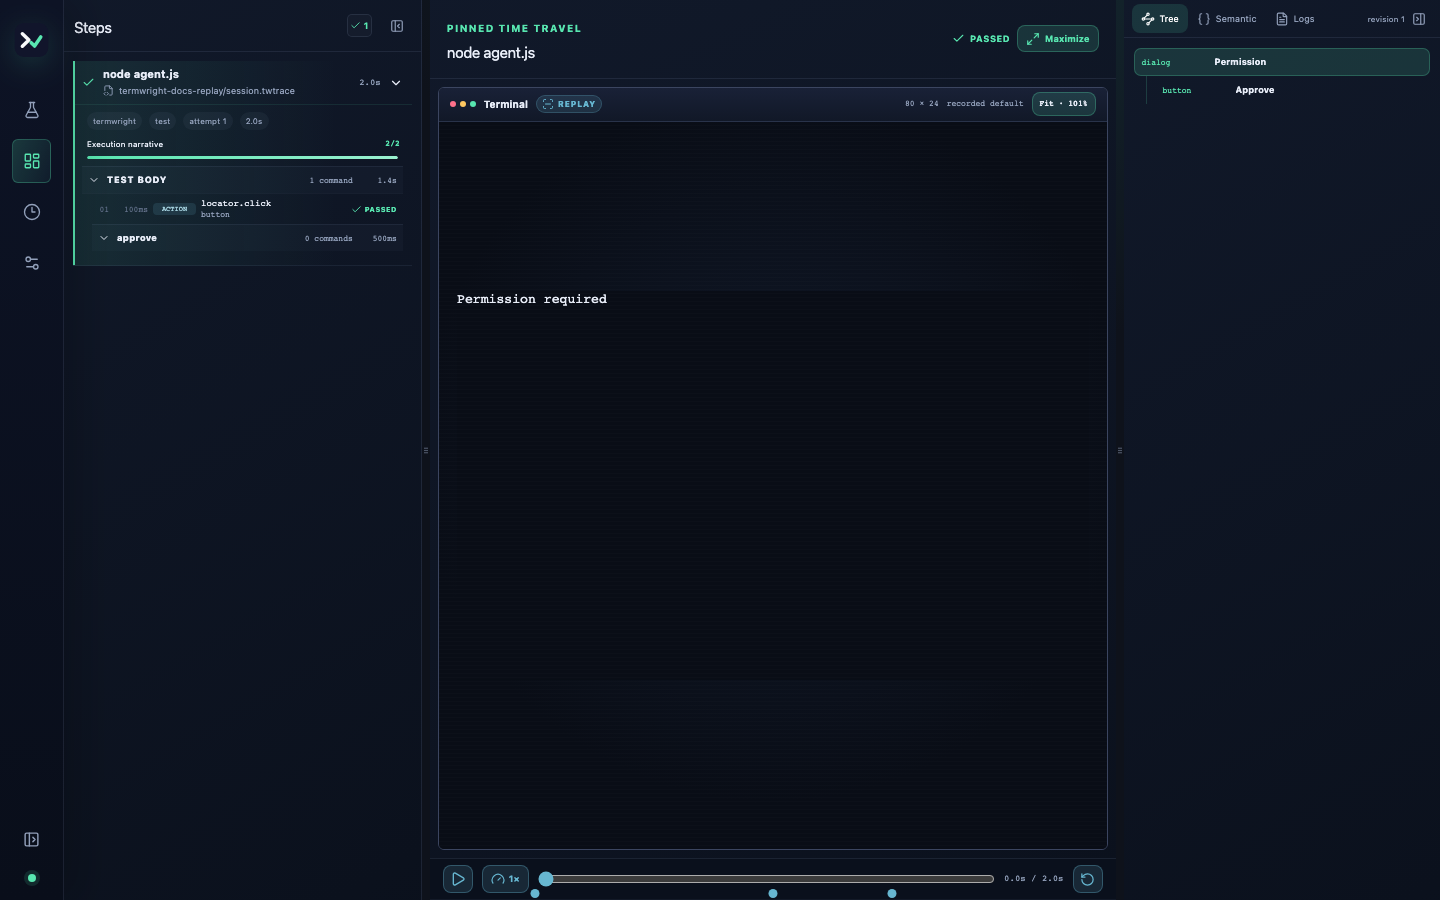
The Tree view shows roles, accessible names, state, and hierarchy published by the framework integration. Select a node to see its properties and whether the current integration supports actions such as click, focus, or type.
A terminal highlight appears only when the recorded state contains geometry for that element. Missing geometry remains unavailable; Runner does not derive a rectangle from matching text.
Open an earlier run
Section titled “Open an earlier run”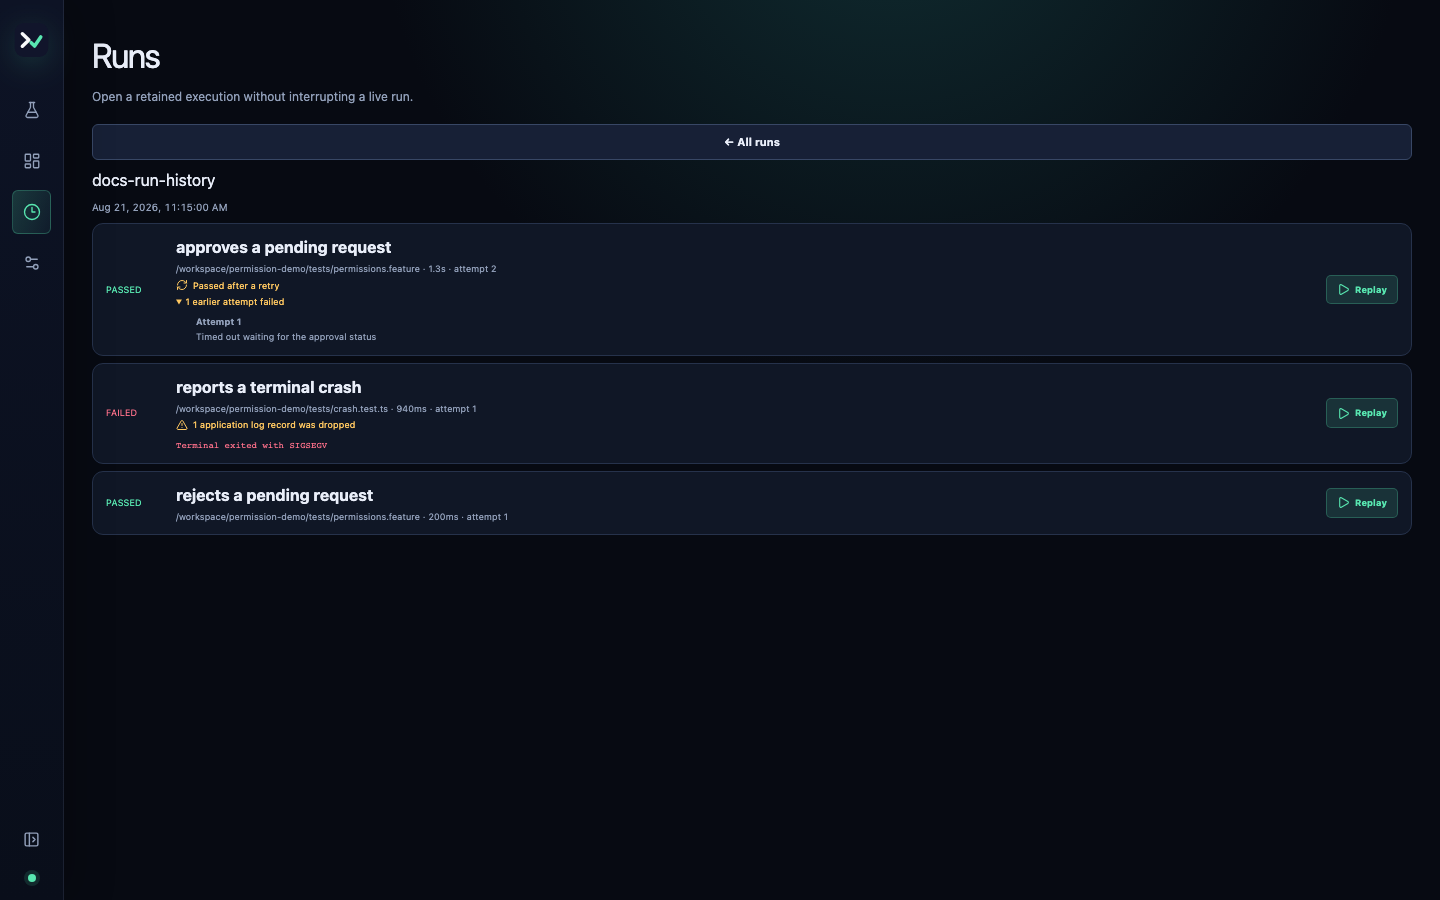
Open Runs to inspect retained results from earlier executions. A run shows its tests, attempts, duration, result, and available traces. Incomplete or damaged records are labelled as such rather than displayed as empty successful runs.
Open a trace path directly when you downloaded it from CI. This starts the post-mortem viewer without running the test suite:
npx termwright ui --trace path/to/run.twtraceRecord a test
Section titled “Record a test”Choose New test → Record test, or launch the recorder directly:
npx termwright ui --record --out-file tests/login.test.ts -- node app.jsInteract with the program, add steps and assertions, then review the generated source before saving it. See Record a test for the full workflow.
Collapsed panels leave a labelled handle at their edge: Tests & steps on the left and Inspector on the right. Select the handle to reopen that panel. The Expand terminal icon in the terminal toolbar temporarily hides the side panels; Restore panels or Escape restores the previous layout. Narrow screens use the Steps, Screen, and Inspect tabs instead.
Change Runner preferences
Section titled “Change Runner preferences”Settings controls the panel layout, replay speed, reduced motion, and source editor. Resetting the layout leaves other preferences unchanged.
For keyboard navigation and focus behavior, see Runner accessibility.